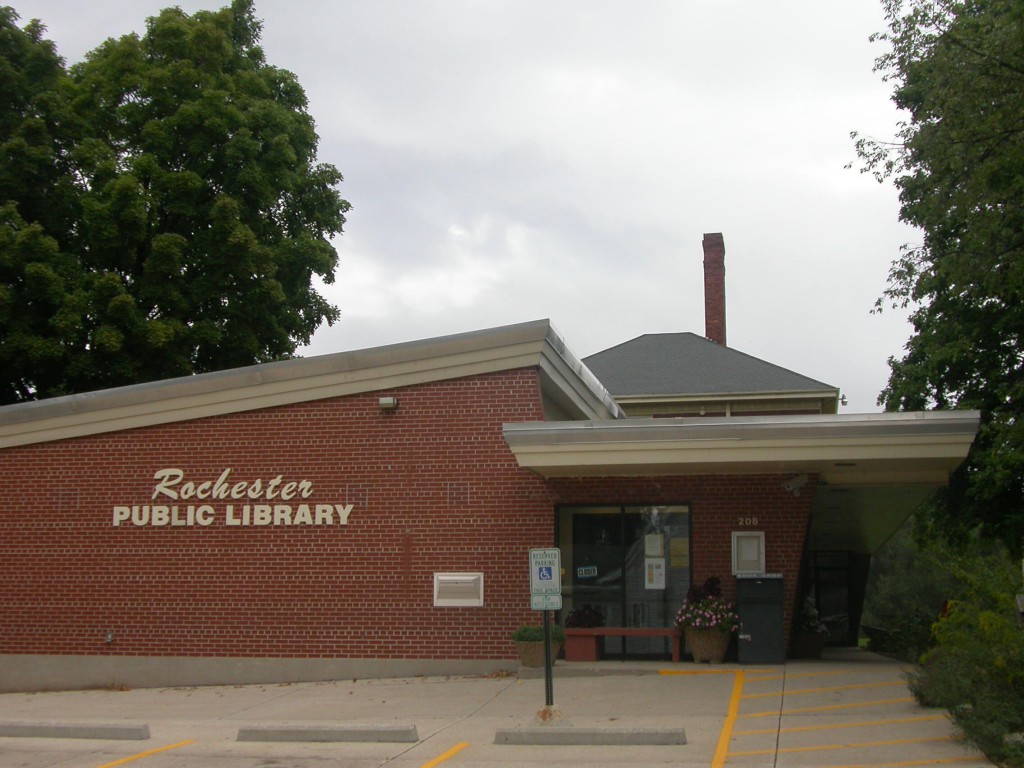
Rochester, WI Real Estate
Information for the community of Rochester
Rochester Real Estate
Market Conditions for Rochester
Median Sale Price
The median sale price for homes in March was $365,000. The median sales price for homes in March rose by $17,550 compared to last month. This represents a 5.05% increase from February. Compared to the same month last year, the median price of homes rose by $365,000 representing a 0% year-over-year change.
The median sales price is the middle value of all sales occurring in the market during the past thirty days when you arrange these sales prices from lowest to highest. This is a better indicator than the average as the median does not change as much as a result of a few unusually low or high sales prices.
Homes for Sale
The inventory of homes for sale remained level in March to 7. Compared to the same month last year when there were 11 homes for sale, the inventory of homes for sale has fallen by 4 representing a -36.36% year-over-year change.
Homes for sale represents the number of active listings on the market during the specified month as reported in the MLS system operating within the market area.
Homes Sold
The 2 homes sold in March was the same as in February. Compared to the same month last year, the number of homes sold increased by 2, a 0% year-over-year increase.
Homes sold is the total count of properties in the market area that have had a closed sale during the specified month as reported in the MLS systems operating within the market area.
Avg Days on Market
The average days on market for a home sold in March (74) increased by 47 days compared to February. This represents a 174.07% increase in days on market for homes in the market from the previous month. Compared to the same month last year, the days on market for homes sold increased by 74, a 0% year-over-year change.
Average Days on Market is the time period between the date when a home is listed for sale in an MLS system and the date it is sold.
Sale/List Price Ratio
The Sale/List Price Ratio of 53.77% in March fell by 43.52% compared to February and increased 0% compared to the same period last year.
Sale/List Price Ratio is the sale price of a listing divided by the original list price expressed as a percentage. The Sale/List Price Ratio for the market is determined by adding the Sale/List Price Ratio for each listing sold in the market during the month and dividing by the number of listings sold during the month.
New Homes
The number of homes listed in March (7) rose by 5 compared to February, a 250% change. Compared to March 2023, the number of new listings increased by 5, a 250% year-over-year change.
Newly Listed Homes are the total count of homes that have been listed within the market area during the most recent month, as reported in the MLS system(s) operating in the market area.
Median List Price
The median list price in March was $575,000. The median list price for homes in March rose by $12,550 compared to last month. This represents a 2.23% increase from February. Compared to the same month last year, the median list price of homes decreased ($32,450) representing a -5.34% year-over-year decrease.
The median list price is the middle value of all currently active listings as reported in the MLS systems in the market area when you arrange these list prices from lowest to highest. This is a better indicator than the average as the median does not change as much as a result of the existence of a few unusually low or high list prices.


 Sign in


