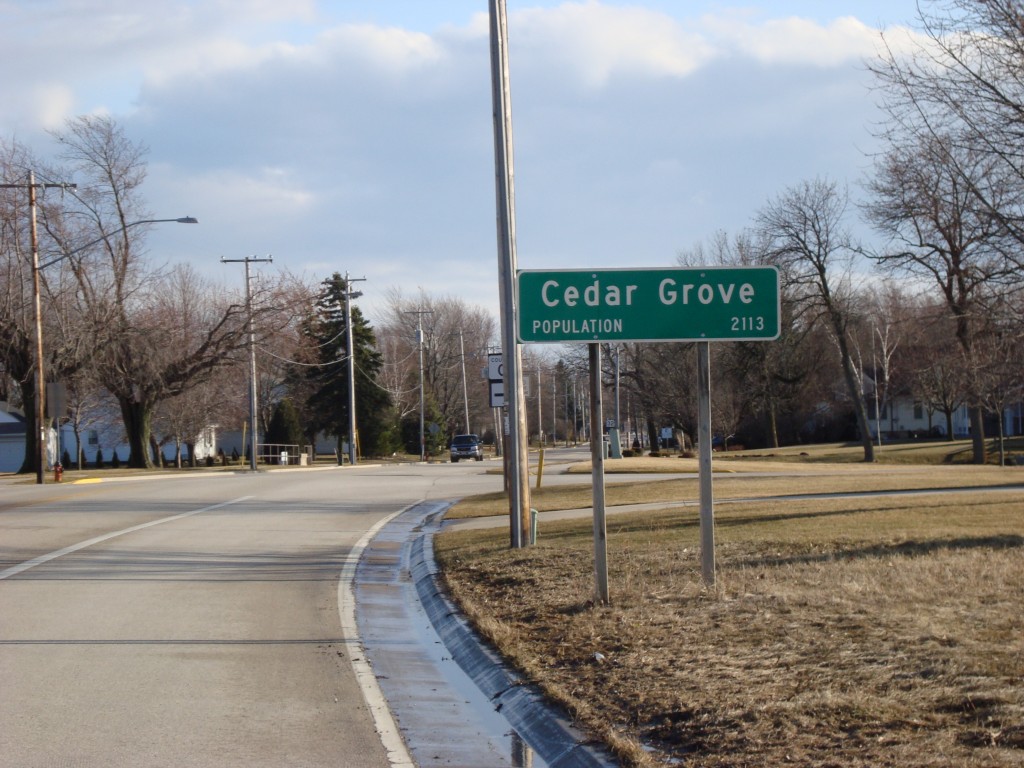
Cedar Grove, WI Real Estate
Information for the community of Cedar Grove
Cedar Grove Real Estate
Deprecated: usort(): Returning bool from comparison function is deprecated, return an integer less than, equal to, or greater than zero in /usr/share/wordpress/community/shorew_community/wp-content/themes/community/schools-city-or-zip.php on line 76
Schools Near Cedar Grove
| District | Type | Enrollment # | Student Teacher Ratio | Test Score Rank | |
| Cedar Grove-belgium Elementary School (Cedar Grove) | Cedar Grove-belgium Area School District | Public | 370 | 18 |

|
| Cedar Grove-belgium High School (Cedar Grove) | Cedar Grove-belgium Area School District | Public | 360 | 13 |

|
| Cedar Grove-belgium Middle School (Cedar Grove) | Cedar Grove-belgium Area School District | Public | 365 | 15 |

|
Population Demographics
| City | County | State | |
| Total Population | 3,480 | 116,090 | 5,852,878 |
| Total Households | 1,363 | 46,558 | 2,349,819 |
| Total Families | 995 | 31,375 | 1,516,725 |
| Percent Male | 50% | 50% | 50% |
| Percent Female | 50% | 50% | 50% |
| White Collar Jobs | 47% | 50% | 58% |
| Blue Collar Jobs | 53% | 50% | 42% |
Top Occupations
| Professions | Population Employed |
| Manufacturing | 160 |
| Professional Services | 142 |
| Sales | 84 |
| Transportation | 76 |
| Healthcare | 66 |
| Maintenance | 64 |
| Construction | 53 |
| Management | 44 |
| Food | 42 |
| Other Services | 39 |
Male Female Breakdown
Population Age
White vs Blue Collar Jobs
Top Professions
Work Transportation Method
Household Income
Education Attainment
| City | County | State | |
| Some High School | 112 | 4,353 | 224,571 |
| High School Graduate | 857 | 29,626 | 1,256,597 |
| Some College | 508 | 16,981 | 833,955 |
| Associates Degree | 313 | 8,108 | 410,260 |
| Bachelors Degree | 350 | 13,274 | 747,113 |
| Graduate Degree | 189 | 5,700 | 384,121 |
Education Attainment
Market Conditions for Cedar Grove
Median Sale Price
The median sale price for homes in March was $344,950. The median sales price for homes in March rose by $65,050 compared to last month. This represents a 23.24% increase from February. Compared to the same month last year, the median price of homes rose by $60,950 representing a 21.46% year-over-year change.
The median sales price is the middle value of all sales occurring in the market during the past thirty days when you arrange these sales prices from lowest to highest. This is a better indicator than the average as the median does not change as much as a result of a few unusually low or high sales prices.
Homes for Sale
The inventory of homes for sale fell by 1 in March to 3. This represents 25% decrease from February when 4 homes were on the market. Compared to the same month last year when there were 2 homes for sale, the inventory of homes for sale has risen by 1 representing a 50% year-over-year change.
Homes for sale represents the number of active listings on the market during the specified month as reported in the MLS system operating within the market area.
Homes Sold
The 2 homes sold in March was 1 more than in February. This represents a 100% increase in sales from February. Compared to the same month last year, the number of homes sold increased by 1, a 100% year-over-year increase.
Homes sold is the total count of properties in the market area that have had a closed sale during the specified month as reported in the MLS systems operating within the market area.
Avg Days on Market
The average days on market for a home sold in March (43) increased by 39 days compared to February. This represents a 975% increase in days on market for homes in the market from the previous month. Compared to the same month last year, the days on market for homes sold increased by 11, a 34.37% year-over-year change.
Average Days on Market is the time period between the date when a home is listed for sale in an MLS system and the date it is sold.
Sale/List Price Ratio
The Sale/List Price Ratio of 101.78% in March rose by 1.46% compared to February and increased 7.49% compared to the same period last year.
Sale/List Price Ratio is the sale price of a listing divided by the original list price expressed as a percentage. The Sale/List Price Ratio for the market is determined by adding the Sale/List Price Ratio for each listing sold in the market during the month and dividing by the number of listings sold during the month.
New Homes
The number of homes listed in March (0) fell by 1 compared to February, a 0% change. Compared to March 2023, the number of new listings decreased by 3, a 0% year-over-year change.
Newly Listed Homes are the total count of homes that have been listed within the market area during the most recent month, as reported in the MLS system(s) operating in the market area.
Median List Price
The median list price in March was $0. The median list price for homes in March fell by ($400,000) compared to last month. This represents a 0% decrease from February. Compared to the same month last year, the median list price of homes decreased ($299,000) representing a 0% year-over-year decrease.
The median list price is the middle value of all currently active listings as reported in the MLS systems in the market area when you arrange these list prices from lowest to highest. This is a better indicator than the average as the median does not change as much as a result of the existence of a few unusually low or high list prices.


 Sign in